Is economic growth a viable strategy for eradicating poverty when we consider the risks of human-induced pollution from economic activity?
An empirical study casting doubts on the existence of a complete Environmental Kuznets Curve
Economic growth is widely recognized as the engine of the development that has brought great improvement in the standard of living of hundreds of millions of people around the world. It is, thus, most often indicated as the best instrument available to nation-states in the struggle for poverty reduction. Industrialized societies, however, are the major contributors to environmental degradation through air and water pollution, production of waste, resource depletion, threats to biodiversity and greenhouse problems. Given the increasing concern over the impact of human economic activity on the environment and increasing evidence that emissions and the exploitation of resources have reached levels which are not sustainable for the environment and are altering natural equilibriums of the planet, it is fundamental to address the question of what relationship links economic growth to the environment.
This essay moves from theoretical economic frameworks for the analysis of environmental impact, economic growth, and the relationship between them, to evaluate the impact of growth on the environment through empirical evidence from a variety of countries. In particular, it discusses the hypothesis for the existence of an Environmental Kuznets Curve (EKC), the idea of an inverted-U relationship between growth and environmental degradation, for which degradation increases with growth only until a turning point from where it declines as growth proceeds.
The complexity of the relationship is acknowledged in the first section through the simplifying framework of the IPAT identity, which shows the conflict between growth and environmental protection. The separate analysis of its elements introduces the EKC hypothesis, which is discussed in the second section. A third section follows, on the data presented to test the EKC hypothesis on a series of countries. Given that the results obtained are not coherent with the hypothesis, possible explanations are given. The next section considers the theory of limits to growth as a possible scenario and its implications for economic equilibria between state., The last section focuses on technology as a possible solution, and supports this idea through reference to the Solow growth model.
I=P∙A∙T
Almost half of the world’s population lives on less than 2.5 dollars a day[1], and, while 12 percent of the world’s population (living in North America and Western Europe and accounts for 60 percent of private consumption spending, a third of humanity (living in South Asia and sub-Saharan Africa) accounts for only 3.2 percent.[2] Is the prospect of economic growth for all compatible with environmental preservation and protection?
The IPAT identity allows for the calculation of the environmental impact of an economy. Generally attributed to Ehrlich[3], it states that the environmental impact (I) is the result of the multiplication of population (P), affluence (A) and technology (T) of the country or region considered. Affluence is measured in GDP per capita and technology in emissions intensity, units per $ of GDP.
The size of population contributes to determining the magnitude of a state’s environmental impact. Citizens’ behaviour has both a direct impact through, for example, garbage disposal and the use of cars, and an indirect one, as with consumers in response to who’s demand production is undertaken[4]. A growing population produces a growing impact on the environment. Controlling and reducing the rate of population growth is one suggested policy for reducing environmental degradation, particularly in developing countries. The population, however, is also the basis for growth, as the people are the workers who produce goods and services.
Per capita GDP is also positively linked to environmental impact, as greater production (and consumption) produces more emissions and waste. Population and GDP growth are the components of the IPAT identity, which produce the scale effect, an upward drive in impact. It instead constitutes the technique effect, which can offset the scale effect partly or fully. It is composed of technological progress and improved energy intensity, which allows the same amount of output with reduced energy inputs, and, consequently, to reduce emissions per unit of output.
The rate of improvement in T compared to the scale effects determines whether impact I increase or decreases. This is a key indication for policy. In order to reduce emissions in a country, technological improvement has to outweigh population and GDP growth. Findings from Stern state that on a global scale there has been no reduction in emissions because the scale effect has been greater than the technique effect[5].
The Environmental Kuznets Curve
The identification of IPAT assumes that growth and environmental impact are positively related. However, evidence of improving environmental standards in industrialized countries particularly since the 70s has brought forward the idea of a possible “de-linking of environmental pressure from economic growth”[6]. This takes the name of the Environmental Kuznets Curve, which represents the capacity of growth after a certain stage of reducing human impact on the environment. The following is a typical representation of the EKC curve. Impact on the environment first grows, then levels off, and then reduces as income increases.
There are three main reasons for how growth would cause such effect.
Change in the structure of the economy
As countries develop they tend to move their production from agriculture to industry, in the process often described as industrialization. Consequently, their emissions increase, with their environmental impact increases accordingly. At a later stage of development, however, countries tend to move away from industrial production towards the production of services. This production involves much less impact on the environment, and it is consequently likely that emissions generally decline in this phase, as compared to the precedent. The figure below represents such changes for the UK and the US.
Source: Rothman, D.S., Environmental Kuznets curves—real progress or passing the buck? A case for consumption-based approaches, Ecological Economics 25, 1998, 177–194
Changes in demand
As people become richer, they are more likely to acquire the desire and the means of spending on luxury goods. Considering environmental quality as a luxury good, it is likely that they will be prepared to spend more on preserving it and maintaining high environmental standards.
Political demand
Not only are individuals and households prepared to spend more privately, but they also reach greater awareness and a shift in values that makes them demand greater protection from the state in terms of public policy and environmental regulations. This results in the impositions of stricter environmental regulations, which contributes to reducing environmental degradation.
Various studies have found such mechanisms to be observable in reality and have shown that there are countries which present an Environmental Kuznets Curve. This next section, though, analyses the data on the emissions of various countries in order to evaluate whether it is possible to claim that a certain level of growth is, indeed, beneficial for the environment.
Evidence for the EKC?
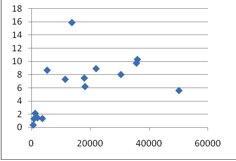
The following graph is the scatter-plot for the relationship between per capita GDP and CO2 emissions in 15 countries that represent a wide spectrum of development and values of per capita GDP. Ghana is the poorest, with a value of $489.1747, and Switzerland is the richest, with a value of $50083.4673. All data is from the World Bank, 2005, in a period of relative economic stability and, at the same time, recent enough for its values to be meaningful.
Figure 1: CO2 emissions (kt) per level of per capita GDP, 2005[7]
It is not possible to identify a level of income after which emissions start falling. An upward trend in emissions as GDP increases can be noted, but there is no pattern that resembles the shape of the theoretical EKC curve. In particular, the right-hand part of the curve is missing, the one where emissions fall: only Switzerland, the last plot to the right, presents a high GDP level and a relatively low level of emissions. The plot that stands out from and above the rest corresponds to the GDP and emissions for Saudi Arabia. Like other oil-rich countries, it has a particularly high level of emissions, in spite of a modest income level (which is itself fuelled greatly by the extraction of oil).
When considering individual countries, the results obtained differ widely. The data presented is below also from the World Bank, and is from the period 1960-2008: it is presented in the form of scatter-plots and is for the already mentioned Switzerland. There is evidence of a downward trend, but not with an inverted-U shape, and, in particular, if the trend was to be projected towards the future, it would imply that there would have to be very high growth to reduce emissions to a substantially lower level.
Source: World Bank
Belgium’s trend is even less regular. Like Switzerland, it shows a tendency towards a reduction in emissions with increasing GDP, but the pattern is not at all clear, with emissions mainly staying between the values of 10 and 12. If looking at another interpretation of the data, it could be said that emissions for Belgium have remained largely constant but have reached peaks at lower levels of growth, increasing the damage to the environment in the process.
Source: World Bank
The US presents a very similar trend, only at much higher levels of emissions. In this case, there is no evidence of a decline in degradation.
Source: World Bank
The United Kingdom registers a constant decrease in emissions, but it does not go below the level of 8, which is still very high.
Source: World Bank
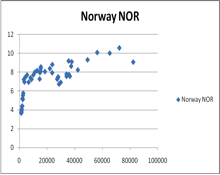
New Zealand and Norway have similar patterns, experiencing a clear growth only until very recently.
Source: World Bank
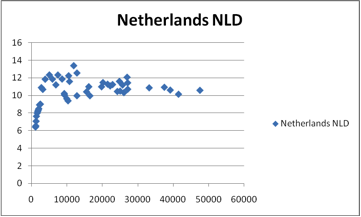
The Netherlands’ trend is very similar to that of Belgium.
Source: World Bank
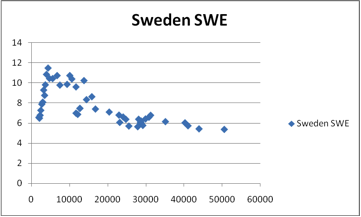
Sweden is the country that experiences the steepest decline in emissions, and even though its graph does not have a U-shape, it does present a clear peak in emissions, at about $10 000 of per capita GDP. Emissions, however, do not tend to particularly low levels.
Source: World Bank
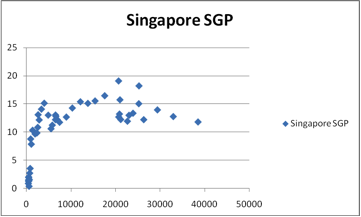
Singapore exhibits data closest to that of a typical EKC shape. Even in this case, though, it is the downward trend that is not marked. In addition, even at very high levels of GDP, emissions are still at a very high level. Also, to be noted is the turning point that can be identified at $20 000, a value double than that of countries like Sweden, the Netherlands and the US.
Source: World Bank
At best, industrialized countries have reached the flat part of the EKC curve[8]. Some may have started to experience a degree of reduction in emissions, but such reduction has very small dimensions compared to past increases. Moreover, considering the levels of growth and per capita income reached in some of the wealtheir countries, the question arises of how much more it would be necessary to achieve in order to substantially reduce emissions.
Many of the studies having found an EKC correlation between growth and environmental impact[9] have considered the damage that is local in nature (i.e. is generated and suffered within a same nation or region). Types of such damage include water pollution, urban sanitation and urban air quality, which have been measured through particulates, nitrus oxide and sulphur oxide. Pollution of this kind is relatively inexpensive to reduce, in terms of monetary costs and lifestyle changes. Nonetheless, measures such as CO2 emissions and municipal waste have contrastingly not been shown to decrease with increasing per capita income. These types of pollution typically trascend national borders, and there is, conseqeuntly, a reduced incentive for abatement: their impacts are relatively easy to externalize and costly to control[10].
Simplistic takes on the EKC relationship have also tended to lose consideration of the complex link between growth and envoronmental protection. Clearly, growth alone does not reduce pollution. Growth facilitates changes in social and political institutions that are required to reduce the impact of economic activity on the environment[11]. There is need for institutional change and political will in order to translate such opportunities into environmental regulations and to overcome costs and path dependency problems for the adoption of new technologies, which may, however, require a change in entire structures of an economy.
The analysis of emission trends in developed countries has also suggested the plausability of the argument that transitions to lower levels of emissions have occurred more as a result of historical events than as a consequence of a certain level of income. Countries at different income levels have experienced co-temporal and abrupt decreases in their emission levels. This suggests that they may have reacted to wide-ranged historical events, rather than to internal economic conditions (e.g. income levels), and in response to external shocks[12].
Emissions fell in OECD countries after 1973. In this period, growth was much lower in comparison to the 60s, thus making it easier for structural and technological change to outweigh the positive effects of growth on emissions, consequently reducing emissions. After 1985, there was a new phase of widespread economic growth, and emissions in this period grew again in most developed countries. These trends suggest that growth has continued to have a positive correlation to emissions[13]. (For confirmation that between 1973 and 1985 CO2 emissions in OECD countries fell by 3.8%, in a period of slow economic growth, see the Dutch Economic Planning Office[14]). Examples of historical shocks include the oil price shocks of the 1970s and the discovery of the ozone-layer hole, with the subsequent creation of an international regime to restrict and eliminate CFC use. The latter example also demonstrates that reductions in emissions have occurred as a result of institutional change.
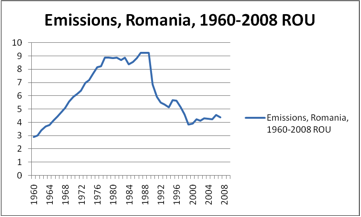
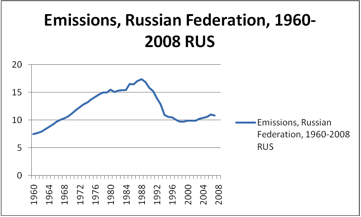
The historical argument also strongly applies to transitional economies. The following are examples of countries that were part of the Soviet Union. Emissions have seen an abrupt reduction around 1990: this is not related to changes in per capita income, but rather to the transition to more modern and less polluting industrial processes, after the move away from centrally planned economies.
Source: World Bank
Another explanation for the noted declines in emissions in rich countries focuses on the analysis of trade and, in particular, on its international dimension, as an alternative to the EKC explanation. “The North is simply exporting its pollution to the South”, write G. Atkinson et al[15]. It has been noted above how countries tend to shift away from industrial production at a certain stage of development. Even within manufacturing, rich western countries have moved away from the processing of raw materials, a highly polluting activity, allowing it to move to developing countries. However, the need for such materials remains, and even increases, with income, meaning that western countries then buy the processed materials from the developing countries. This process allows the rich countries to reduce the pollution stemming directly from their own economic activity, while, on a global and environmental scale, it simpy shifts pollution to other areas of the planet. In fact, this most often increases the overall levels of pollution, as developing countries lack the technology and sophistication in capital that developed countries may have (which limits emissions per unit of output). Such mechanisms do not represent a solution to environmental problems, which means that these mechanisms ultimately have a global dimension: in particular, they do not represent a possible path for reducing the environmental impact of developing countries, as “there will be no countries coming up behind them to which environmentally-intensive activities can be relocated”[16].
A Possible Meeting Point: Technology
Given that there is at least a doubt on whether economic growth is compatible with environmental protection, can growth be considered totally desirable and constantly achievable? The environment provides indispensable inputs for production and, thus, for growth: to the extent that environmental capital is limited, growth is also limited. Any economy that looks to depleting its resources is bound to reach a no-growth point, at the end of the process of dimininishing returns. Other types of capital are needed to sustain growth, in particular man-made capital. As the Solow model shows, even considering a high level of substitutability between natural and man-made capital, however, the latter also experiences diminishing returns and is not sufficient enough to produce long-term economic growth.
A prospect of no growth is not appealing. Rich countries have experienced periods of low or zero economic growth, which have in turn caused economic crisis, unemployment, fiscal instability and difficulties in funding public services[17]. This experience has contributed to the importance given in the West to economic growth. When facing the idea that growth deteriorates the environment, a looming scenario has appeared for western countries: having acknowledged the environmental damage created by growth and, at the same time, the rightful quest for better living conditions in developing countries, it has been clear that “dealing with poverty [would] involve redistribution”[18]. When 21 countries met to produce the Brundtland Report, a no growth strategy was not considered as a desirable solution, and commissioners concluded that what was needed was “a new era of economic growth- growth that is forceful and at the same time socially and environmentally sustainable”[19]. It specified that sustainable levels of growth (i.e. growth that would improve wealth while not increasing environmental damage) were 3% of GDP for developed countries and 5% for developing countries. Later studies have found such figures as being too generous, however, and have indicated other levels of growth. The table below is from Bruyn.
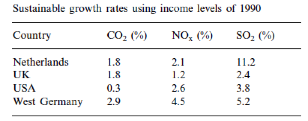
Source: de Bruyn, S. M., van den Bergh, J. C. J. M., Opschoor, J. B., ‘Economic Growth and Emissions: Reconsidering the Empirical Basis of Environmental Kuznets Curves’, Ecological Economics 25, 1998, 161-175
As explained above, sustained growth cannot be obtained simply through capital inputs. What can sustain growth indefinitely is technological change. As the Solow growth model shows, “in the long run, countries exhibit per capita growth at the rate of technological progress”[20].
Even with hypothesising the existence of an EKC for all countries (which has not been found in the analysis above), it is clear that the majority of countries still would have to reach the turning point. Acoordingly, in the process, emissions worldwide would grow incredibly, deteriorating a situation that had already been unsustainable. For growth and environmental protection to be compatible, technology must be the driver of growth. In particular, it is necessary for rich countries to provide developing economies with the technologies available, in order to leap-frog towards a much higher state of development without destroying the environment.
Conclusions
This essay has dealt with the relationship between economic growth and environmental protection. It has attempted to evaluate whether the two are compatible, or if the former undermines the latter. This is crucial in the outlining of policies that aim to alleviate (and possibly eradicate) poverty through economic growth, as the Millennium Development Goals (MDGs) do. It shows how there is no clear evidence of a negative relationship between growth and CO2 emissions. In particular, there is little indication of an EKC-type relationship, which suggests that there is a level of income after which emissions are reduced as income continues to grow. There is mostly a lack of evidence of a downward slope (the right-hand part of the theoretical inverted-U shape).
Emission trends in developed countries do not show such tendency either. Most importantly, they present very different curves, and it is not possible to extract a general framework or trend. This shows that environmental protection is strongly related to national characteristics and national responses to environmental challenges. These may be partly related to growth, but often are separate factors fundamental in the analysis of environmental protection and emissions. This essay has focused on the distinction between different types of pollutants, noting how the ones for which the EKC hypothesis has been confirmed mainly create pollution that does not transcend national borders, and for which abatement is thus less costly and more worthwhile. It also underlined the importance of institutional changes and environmental regulations: even in the unlikely case that growth is beneficial for the environment after a certain level, it can only pose the conditions for abatement. It does not automatically reduce emissions. Thirdly, it has suggested that historical events and economic shocks may have been the factors contributing to the changes in emissions, rather than growth. The paper also referred to the international dimension of trade to find dynamics that may have given the illusion of a Kuznets Curve: the shift of highly polluting production away from developed nations towards developing ones may have reduced the environmental impact of the former without however reducing the global impact on the environment.
The final part of the essay linked back to the IPAT identity to focus on technological advancement as the element that allows the coexistence of economic growth and environmental protection. It explains how long-term growth is not obtainable without technological progress: it is technological improvement that allows to produce greater amounts of output with the same level of energy inputs, or the same amount of output with lower levels of inputs. If all nations in the world are to develop and reach the living standards of the west, the impact of such growth would not be sustainable for the environment if it were fuelled by traditional means of production. It is necessary to provide developing countries with the green and efficient technologies available, and aim to allow only technology-driven growth.
Bibliography
Atkinson, G., Dietz, S., Neumayer, E. (eds), Handbook of Sustainable Development, Cheltenham : Edward Elgar, 2007
Central Planning Bureau (CPB), Scanning the Future: A Long-Term Scenario Study of the World Economy 1990-2105, SDU Publishers: The Hague, 1992
Common, M., Stagl, S., Ecological Economics: An Introduction, Cambridge: Cambridge University Press, 2005
de Bruyn, S. M., van den Bergh, J. C. J. M., Opschoor, J. B., ‘Economic Growth and Emissions: Reconsidering the Empirical Basis of Environmental Kuznets Curves’, Ecological Economics 25, 1998, 161-175.
Duchin, F., Structural Economics: Measuring Changes in technology, Lifestyle and the Environment. Island Press, Washington DC, 1998
Ehrlich, P., Holden, J., ‘Impact of Population Growth’, Science, 171: 1212-17
Ehrlich, P. and Holdren, J., ‘Review of The Closing Circle’, Environment, April 1972, 24-39
Grossman, G.M., Krueger, A.B., Environmental Impacts of a North American Free Trade Agreement. Woodrow Wilson School, Princeton, NJ, 1992
IBRD (International Bank for reconstruction and Development), Development and the Environment, World Development Report (World Bank), Oxford University Press, Oxford
Jones, C. I., Introduction to Economic Growth, 2nd ed., London: WW Norton, 2002
Panayotou, T., Empirical Tests and Policy Analysis of Environmental Degradation at Different Stages of Economic Development. Working Paper, Technology and Environment Programme, International Labour Office, Geneva., 1993
Rothman, D. S., ‘Environmental Kuznets curves—real progress or passing the buck? A case for consumption-based approaches’, Ecological Economics 25, 1998, p 177
Selden, T.M., Song, D., ‘Environmental quality and development: is there a Kuznets curve for air pollution estimates?’ Journal of Environmental Economics and Management 27, 1994, 147–162
Shafik, N., Bandyopadhyay, S., Economic Growth and Environmental Quality: Time Series and Cross-Country Evidence, Background Paper for World Development Report 1992, World Bank, Washington, DC., 1992
Simmons, U. E., Industrial Restructuring for Sustainable Development: Three points of departure. Science Centre Berlin FS II, 1989, 89-401
Stern, D. I., ‘Progress on the Environmental Kuznets Curve?’, Environment and Development Economics, 3 (2), 2002: 173-196
Suri, V., Chapman, D., ‘Economic Growth, Trade and Energy: Implications for the Environmental Kuznets Curve’, Ecological Economics 25, 1998, p 195-208
UN World Commission on Environment and Development (WCED), Our Common Future, Oxford: Oxford University Press, 1987
Unruh, G. C., Moomaw, W. R., ‘An Alternative Analysis of Apparent EKC-Type Transitions’, Ecological Economics, 25 (1998) 221–229.
Electronic Sources:
Global Issues, available at http://www.globalissues.org/article/26/poverty-facts-and-stats [accessed March 8th 2011]
World Bank Data, available at http://data.worldbank.org/ [accessed March 5th 2011]
WorldWatch Institute, available at http://www.worldwatch.org/node/810 [accessed March 9th 2011]
[1] Global Issues, available at http://www.globalissues.org/article/26/poverty-facts-and-stats [accessed March 8th 2011]
[2] WorldWatch Institute, available at http://www.worldwatch.org/node/810 [accessed March 9th 2011]
[3] See P. Ehrlich, J. Holden, Impact of Population Growth, Science, 171: 1212-17. And P. Ehrlich, and J. Holdren, ‘Review of The Closing Circle’, Environment, April 1972, pp 24-39.
[4] F. Duchin, Structural Economics: Measuring Changes in technology, Lifestyle and the Environment. Island Press, Washington DC, 1998
[5] D. I. Stern, ‘Progress on the Environmental Kuznets Curve?’, Environment and Development Economics, 3 (2), 2002: 173-196.
[6] U. E. Simmons, Industrial Restructuring for Sustainable Development: Three points of departure. Science Centre Berlin FS II, 1989, 89-401. IBRD (International Bank for reconstruction and Development), Development and the Environment, World Development Report (World Bank), Oxford University Press, Oxford, p 308
[7] Countries included are Belgium, Egypt, Ghana, Greece, India, Italy, Japan, Morocco, Namibia, Portugal, Saudi Arabia, Slovak Republic, Slovenia, South Africa, and Switzerland.
[8] For this point of view see also V. Suri , D. Chapman, ‘Economic Growth, Trade and Energy: Implications for the Environmental Kuznets Curve’, Ecological Economics 25, 1998, p 205-6
[9] See the following. G.M. Grossman, A.B.Krueger, Environmental Impacts of a North American Free Trade Agreement. Woodrow Wilson School, Princeton, NJ, 1992; N. Shafik, S.Bandyopadhyay, Economic Growth and Environmental Quality: Time Series and Cross-Country Evidence, Background Paper for World Development Report 1992, World Bank, Washington, DC., 1992; T. Panayotou, Empirical Tests and Policy Analysis of Environmental Degradation at Different Stages of Economic Development. Working Paper, Technology and Environment Programme, International Labour Office, Geneva., 1993; T.M. Selden, D. Song, ‘Environmental quality and development: is there a Kuznets curve for air pollution estimates?’ Journal of Environmental Economics and Management 27, 1994, 147–162
[10] D. S. Rothman, ‘Environmental Kuznets curves—real progress or passing the buck? A case for consumption-based approaches’, Ecological Economics, 25 (1998), p 177
[11] Ibid, p 179 G. Atkinson, S. Dietz, E. Neumayer (eds), Handbook of Sustainable Development, Cheltenham : Edward Elgar, 2007, p 251
[12] G. C. Unruh, W. R. Moomaw, ‘An Alternative Analysis of Apparent EKC-Type Transitions’, Ecological Economics, 25 (1998) 221–222
[13] See also S. M. de Bruyn, J. C. J. M. van den Bergh, J. B. Opschoor, ‘Economic Growth and Emissions: Reconsidering the Empirical Basis of Environmental Kuznets Curves’, Ecological Economics, 25 (1998), p 172
[14] Central Planning Bureau (CPB), Scanning the Future: A Long-Term Scenario Study of the World Economy 1990-2105, SDU Publishers: The Hague, 1992
[15] G. Atkinson, S. Dietz, E. Neumayer (eds), Handbook of Sustainable Development, Cheltenham : Edward Elgar, 2007, p 246
[16] D. S. Rothman, ‘Environmental Kuznets curves—real progress or passing the buck? A case for consumption-based approaches’, Ecological Economics, 25 (1998), p 182
[17] M. Common, S. Stagl, Ecological Economics: An Introduction, Cambridge: Cambridge University Press, 2005, p 363
[18] Ibid, p 245
[19] UN World Commission on Environment and Development (WCED), Our Common Future, Oxford: Oxford University Press, 1987, p XII
[20] C. I. Jones, Introduction to Economic Growth, 2nd ed., London: WW Norton, 2002
—
Written by: Luca Ferrini
Written at: University of Reading
Written for: Christian Nygaard
Date written: March 2011
Further Reading on E-International Relations
- Environmental Protection or Economic Growth: What Do Nigerians Think?
- Assessing Global Response to Rising Sea Levels: Who Needs to Be Involved?
- Beyond Apocalypse: Securitization and Exceptionalism in Environmental Politics
- Assessing Globalisation’s Contribution to the Sex Trafficking Trade
- From Environmental Scarcity to ‘Rage of the Rich’ – Causes of Conflict in Mali
- Justified Alarmism? Assessing the Claim of a Contemporary ‘Authoritarian Wave’


