Following the 7 October 2023 Hamas attacks, Israel’s military operations in Gaza and their humanitarian consequences have brought the question of trade sanctions on Israel into public debate. As of July 2024, Israel’s offensive has resulted in the deaths of over 37,000 Palestinians. This number could rise to over 186,000 when considering indirect deaths due to, among other factors, destroyed health-care infrastructure or food and water shortages. Seventy per cent of Gaza’s houses have been destroyed, and eighty per cent of the population has been displaced. In response, Turkey has suspended trade while other countries, including Belgium, Canada, Italy, Japan, the Netherlands and Spain, have decided to cease arms trade. In Europe, governments in Belgium, Ireland and Spain have publicly advocated for the implementation of trade sanctions. The issue has also been raised in the European Union’s Foreign Affairs Council.
Economic sanctions have become a prominent tool in contemporary foreign policy. As of 2023, the UN manages 14 ongoing sanctions, while the United States has imposed over 25 since the early 2000s. Research on their effectiveness suggests that economic sanctions tend to be more effective when they impose substantial economic costs on the target economy, are multilateral and led by international institutions, aim for moderate policy changes rather than ambitious goals, target allies rather than adversaries, and are directed at democratic regimes.
In this analysis, I use a multi-country, multi-sector model of trade to examine the effects of tariff sanctions on Israel. The model is based on De Souza et al (2024), Caliendo and Parro (2015) and Ossa (2014). Firms in each country competitively produce tradable goods in different sectors that are used both for final consumption and as production factors alongside labor and intermediate inputs. Trade is subject to iceberg costs as well as import and export tariffs set by governments. I calibrate the model using the OECD Inter-Country Input-Output table, a dataset that describes the interdependencies between 45 economic sectors and 76 countries. I classify countries into 4 groups based on their vote on resolution (A/ES-10/L.30/Rev.1) for Palestine’s admission to the UN: Israel, countries that voted against the resolution (abbreviated “UN-Ag”, 9 countries including the United States, Argentina, Hungary), countries that voted for the resolution (abbreviated “UN-For”, 143 countries including China, France, Japan), and countries that abstained (abbreviated “UN-Abs”, 25 countries including the United Kingdom, Germany, Italy, Canada). Figure 1 presents a map of countries based on their different votes.
I assume that the sanctioning countries are those in the “UN-For” group. I acknowledge that this assumption involves a significant degree of arbitrariness. The question of which countries are more likely to impose sanctions is beyond the scope of this analysis. The objective here is rather to evaluate the effects of such sanctions. I have compared this group with other hypothetical coalitions of sanctioning countries: the European Union, the BRICS (Brazil, Russia, India, China, South Africa), and the United States. Finally, while I focus here on the economic consequences of import and export tariffs, economic sanctions can also be implemented through various other means, including asset freezes, sanctions on financial markets, or entry restrictions for key government officials and business executives.
The results, displayed in Table 1, show that export tariffs would have slightly more impact than import tariffs. With a 20% change in import tariff, Israel’s gross national income (GNI) would decrease by 1.31%, and up to 2.20% with a ban on imports. For a 20% change in export tariff, the decrease would be of 1.46%, and be 2.77% with an export ban. When the two measures (import and export tariffs) are combined, the decrease ranges from 2.50% (20% tariff) to 4.15% (trade embargo). Finally, in all scenarios, the impact of sanctions on other countries (both sanctioning and non-sanctioning) is negligible, around -0.02%. This means that there is no economic trade-off regarding the level of tariffs: it is a political choice.
Table 2 compares the results for different coalitions of sanctioning countries. An increase in import and export tariffs by 20% from the European Union would reduce Israel’s GNI by 1.02%. The same increase from the BRICS would reduce it by 0.77%, roughly the same as the United States (0.75%). For comparison, the impact of a trade embargo from the EU would be -1.81%, from the BRICS -1.31% and from the United States -1.37%. At the extreme, if all countries of the world were involved in a trade embargo, the impact would be -7.33%. This shows that the larger the coalition imposing sanctions, the more significant the economic impact.
These values are within the range of Neuenkirch and Neumeier (2015), who estimate the impact of “severe” UN sanctions, such as complete embargos imposed by UN member states against a target country, on the order of -5% to -6% on GDP growth. They are also in line with Armington model’s predictions that the welfare gains from trade should be at least equal to 1 − λ−1/ε, where λ is one minus the import penetration ratio and ε is the trade elasticity. Israel’s import penetration ratio is 17%, hence λ = 0.83, trade elasticity is around -5, implying welfare losses from embargo to be at least 3.66%.
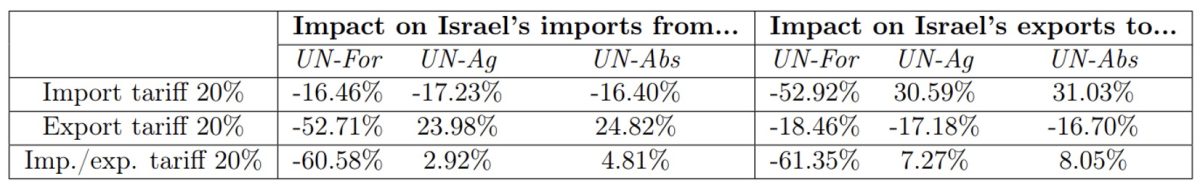
Table 3 displays the effect of sanctions on trade between Israel and other countries. The imposition of a 20% import (resp. export) tariff by UN-For would reduce Israel’s export to (resp. import from) these countries by 52.92% (resp. 52.71%). It would partially be offset by an increase in Israel’s exports to (resp. imports from) non-sanctioning countries: 30.59% to UN-Ag, 31.03% to UN-Abs (resp. 23.98% from UN-Ag, 24.82% from UN-Abs).
I now study the breakdown of the effects of trade sanctions by sector. I assume that sanctioning countries impose a 20% increase in import and export tariffs, and that Israel does not impose any counter-sanctions. I also assume no sanctions on food and pharmaceutical products.
Figure 2 illustrates the change in purchasing power of wage (PPW) across various sectors. It reveals how much the quantity of goods or services that can be bought with a unit of wage changes in each sector as a result of the sanctions. The sectors experiencing the most significant decrease in PPW are fossil fuels (-14.07%) and textiles (-13.83%). Refined petroleum (-8.43%) is also notably affected due to the impact on fossil fuels. Other sectors showing considerable declines include automobiles (-10.06%), air transport (-9.92%) and electrical equipment (-9.63%). The effects on essential goods, such as food (-2.58%), pharmaceuticals (-1.85%), and electricity (-1.73%), remain moderate.
I finally examine which sectors are the most effective targets for sector-specific sanctions. Figure 3 illustrates the changes in Israel’s GNI resulting from a trade embargo in each sector. The sectors where targeted sanctions would be most effective include wholesale and retail trade, information technologies (IT), computers, and scientific services. These last three sectors emphasize Israel’s reliance on its high-tech economy. As of 2022, the high-tech sector constituted 18.1% of Israel’s GDP, a four percentage point increase from 2012, making it the leading sector in the country’s economy. High-tech also accounted for 48.3% of Israel’s exports, a figure that has more than doubled over the past decade.
The results of this study indicate that tariff sanctions could have significant effects on Israel’s gross national income. Sanctions are found to be more effective when they involve a large number of sanctioning countries and when they target high-tech products and services.
Tables and Figures
Figure 1: Map of countries based on their vote on resolution (A/ES-10/L.30/Rev.1) for the admission of Palestine as a UN member state.
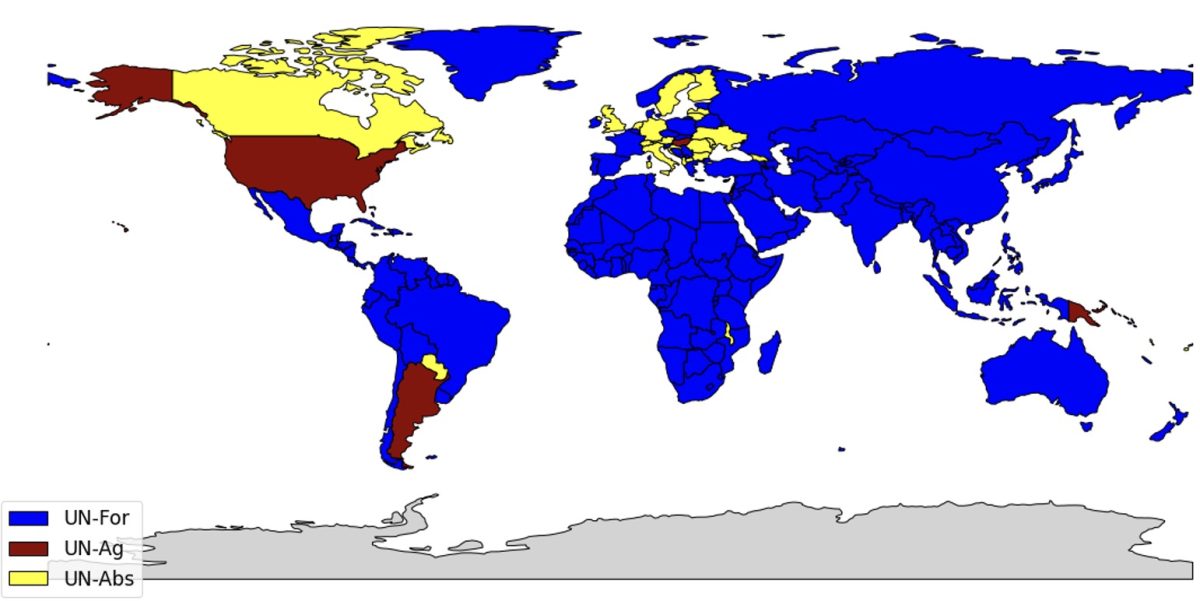
Figure 2: Change in purchasing power of wage by sector.
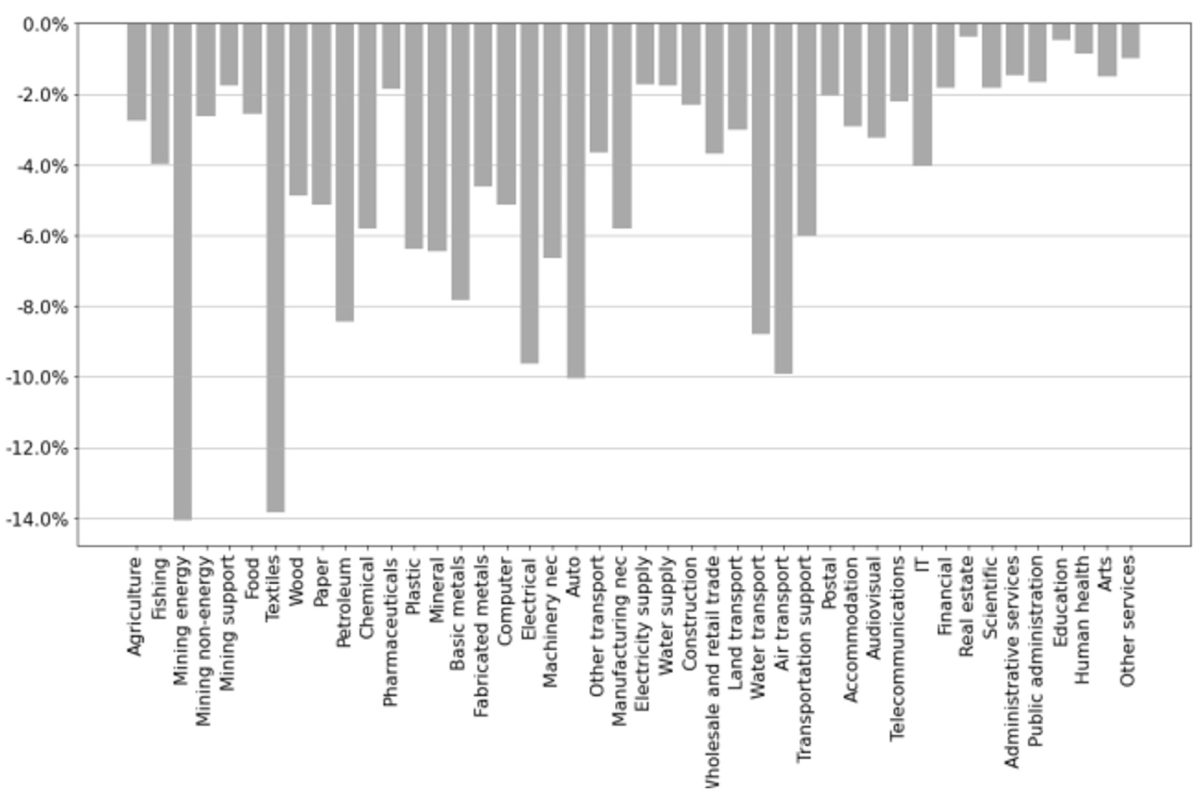
Figure 3: GNI impact of sector-specific trade embargo by sector.
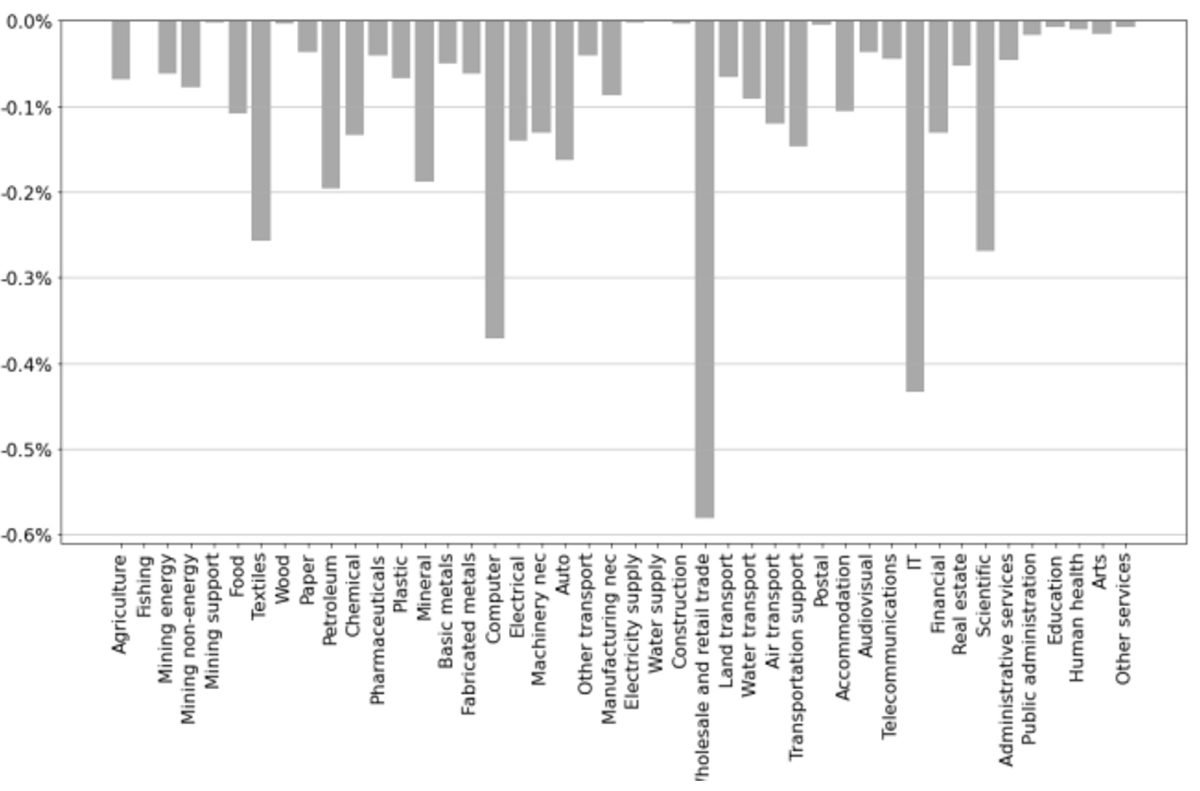
Table 1: Change in Israel’s gross national income for various tariff changes.
Note: Import sanctions correspond to an increase in import tariffs by the sanctioning coalition. Export sanctions correspond to an increase in export tariffs by the sanctioning coalition.
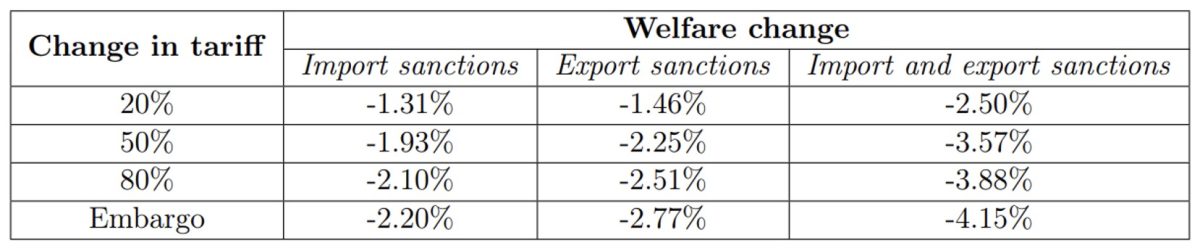
Table 2: Change in Israel’s gross national income for various sanctioning coalitions.
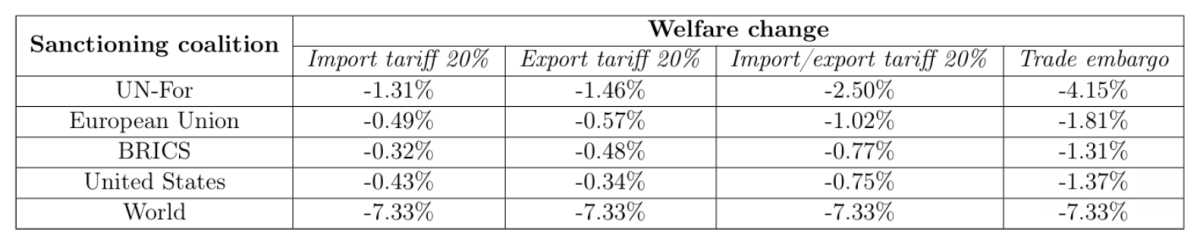
Table 3: Impact of tariff sanctions on Israel’s imports and exports.
Further Reading on E-International Relations
- Seeing Through the Fog of Justice in Israel and Palestine
- Opinion – The Role of Smart Power and Collective Action in the Israel-Palestine Conflict
- Opinion – The International Community Should End the Israel-Hamas War
- Gaza First: The Centrality of Gaza in Israeli-Palestinian Conflict Resolution
- Opinion – Assessing the Legality of Ousting Hamas
- Opinion – America’s Strategic Maneuver on Gaza at the United Nations